When Disaster Strikes: What Permit Data Shows Claims Teams After Severe Weather Events

Nina Wooten

When Disaster Strikes: What Permit Data Shows Claims Teams After Severe Weather Events
Article
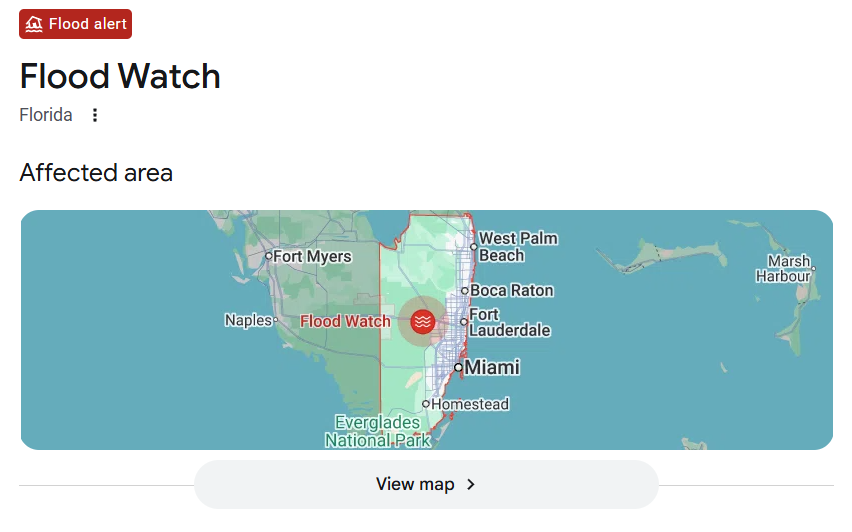
From coast to coast, severe weather is impacting many communities across the United States. In November 2026, heavy rains have flooded parts of South Florida causing Broward County to declare a local state of emergency, according to CBS Miami.
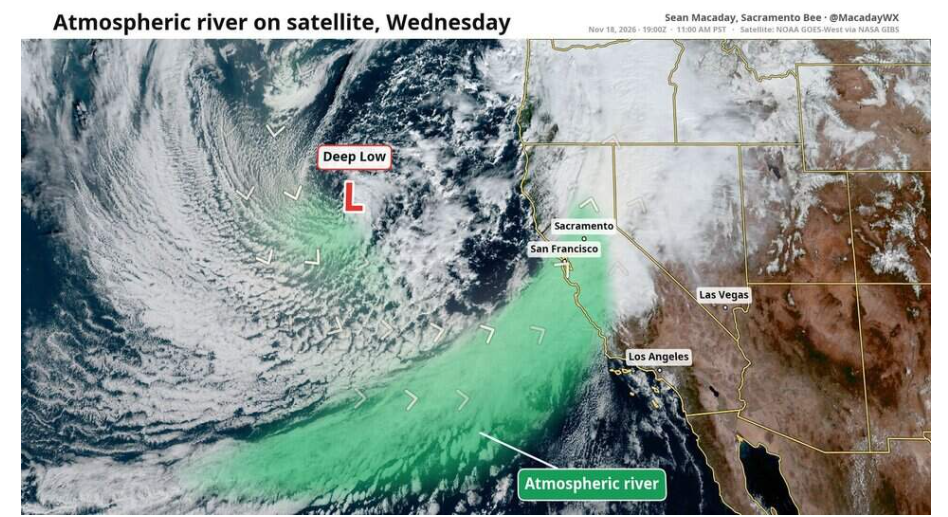
California is experiencing a powerful storm caused by an atmospheric river that's left much of the Bay Area underwater, with flooded roadways, downed trees and power outages. The extreme weather patterns are likely to continue through the winter as NOAA's Climate Prediction Center has an El Niño Advisory in effect and predicts a greater than 79% chance that a strong to very strong event continues through January to March 2027.
For claims teams, weather events like these start a workflow that runs for months. Depending on the level of damage, catastrophe adjusters deploy on assignments that may last weeks at a time (NACA). Thousands of claims can open within days, and flooded roads and closures slow site visits.
Permit records document the recovery effort showing rebuild and repair projects. Gryd tracks new permits for roofing, new construction and more across the country that can be used for modeling and analysis after a severe weather event.
Key takeaways
- Roofing permits peak months after a hurricane. In five hurricane-hit metros, Gryd's roofing permit counts ran well above the prior year within a month of landfall and peaked within two to four months.
- History sets expectations. Reviewing how permit activity unfolded after comparable events gives claims teams a starting estimate of how much repair work to expect, when it may arrive, and what it may cost.
- Roof age resets after a repair. New roofing permits post-storm is a dated record of roof work, so roof age on a later claim can be checked against permit history instead of out of date files.
Monitoring activity and measuring potential impact
Permit data can support analysis and forecasting for claims teams after a weather event such as this week's flooding. Start by reviewing historical patterns of how permit activity unfolded after comparable events in the area. Looking at permit counts and declared job values can help build a starting estimate of how much repair demand to expect, when it may arrive, and what it may cost. Declared job values are not appraisals but can provide a helpful benchmark.
Permit data can show the repair history at an address, including roof work done before the event. This table shows the roofing permits Gryd has tracked over the last year in California and Florida who are now facing severe weather, setting a baseline for the next few months. We expect these counts to rise as repairs get under way, and will compare future months against this baseline to show the recovery impact.
Roof age after the storm
A roofing permit issued after a storm is a dated record of roof work at that address. When the same property files a claim after the next storm, roof age is no longer a number from the policy file. It can be checked against the permit history, including whether the work was completed and inspected. Consider a policyholder who reports a full roof replacement two years ago and now reports another total loss. If permit records show no roofing permit in that period, that is a reason for further review, not proof of a problem, because unpermitted work does not appear in permit data.
Checking a paid roof claim
For a roof claim, adjusters and SIU teams can check whether a permit exists, when it was filed, its status, any recorded inspections, and the contractor who pulled it. After a catastrophe, that check can run across thousands of claims at once instead of one file at a time.
Look up permit history on millions of properties with Gryd →
Spotting contractors who arrive with the storm
The National Insurance Crime Bureau warns that contractor fraud surges after disasters and lists out-of-state licenses as a potential warning sign. A contractor profile that shows no permit history in the jurisdiction before the event is a different kind of lead than one with years of local permits.
In a typical claim, the insurer inspects, estimates, and pays for covered repairs, but regulators in Washington and the District of Columbia both say the homeowner chooses the contractor, and the insurer can only recommend one. That means the contractor on a claim is often one the carrier has not vetted, which makes the contractor's permit history important to check. Rules vary by state and policy.
Wind and water: the roofing surge
The Insurance Information Institute (Triple-I) reports that for the third straight year, tornadoes, hail, straight-line winds and severe thunderstorms caused over $50B in U.S. insured losses in 2025. Roofs bear an estimated 70% to 90% of insured residential catastrophe losses. That makes roof age one of the first facts a claims team needs after a storm.
In Gryd's data, roofing permits in metros hit by hurricanes have grown well above the prior year in the months after landfall. In each of five metros, the month after landfall was on average about 4x higher than the same month a year earlier. Each metro peaked within two to four months after the hurricane.
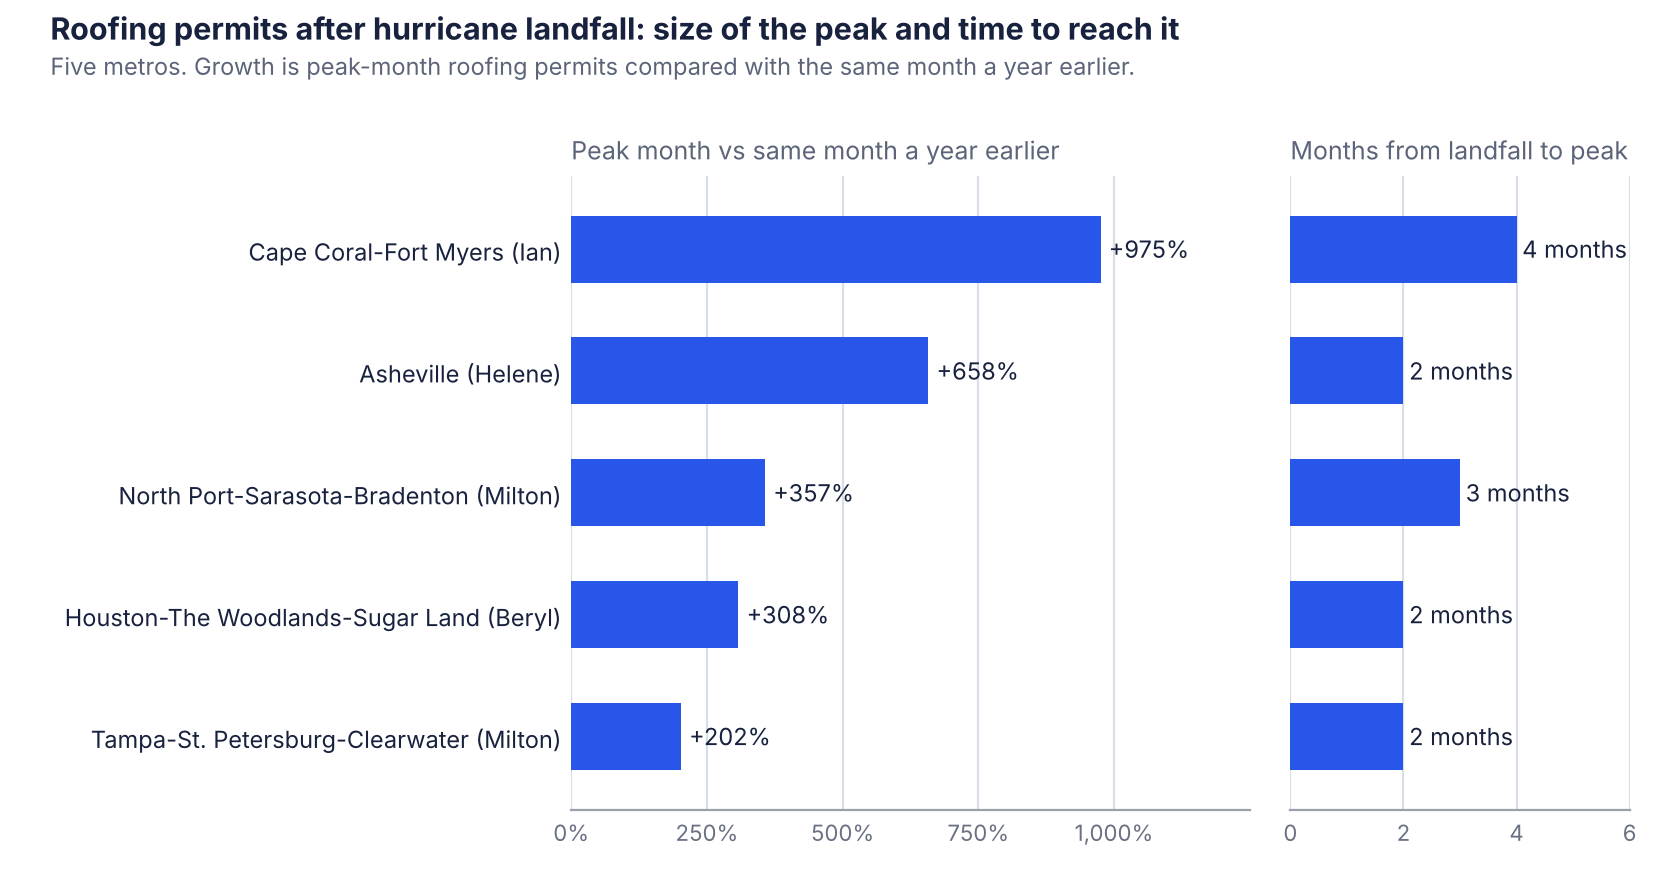
Twelve months after landfall, Cape Coral-Fort Myers was still at 1.83 times the prior year and Asheville at 2.26, while Tampa was back near 1.0. Tampa and Houston include jurisdictions not impacted as heavily flattening out some of the growth trends. Gryd's coverage in each metro changed over this time period as well including more jurisdictions with historical data to report on.
Permit data activity after wildfires
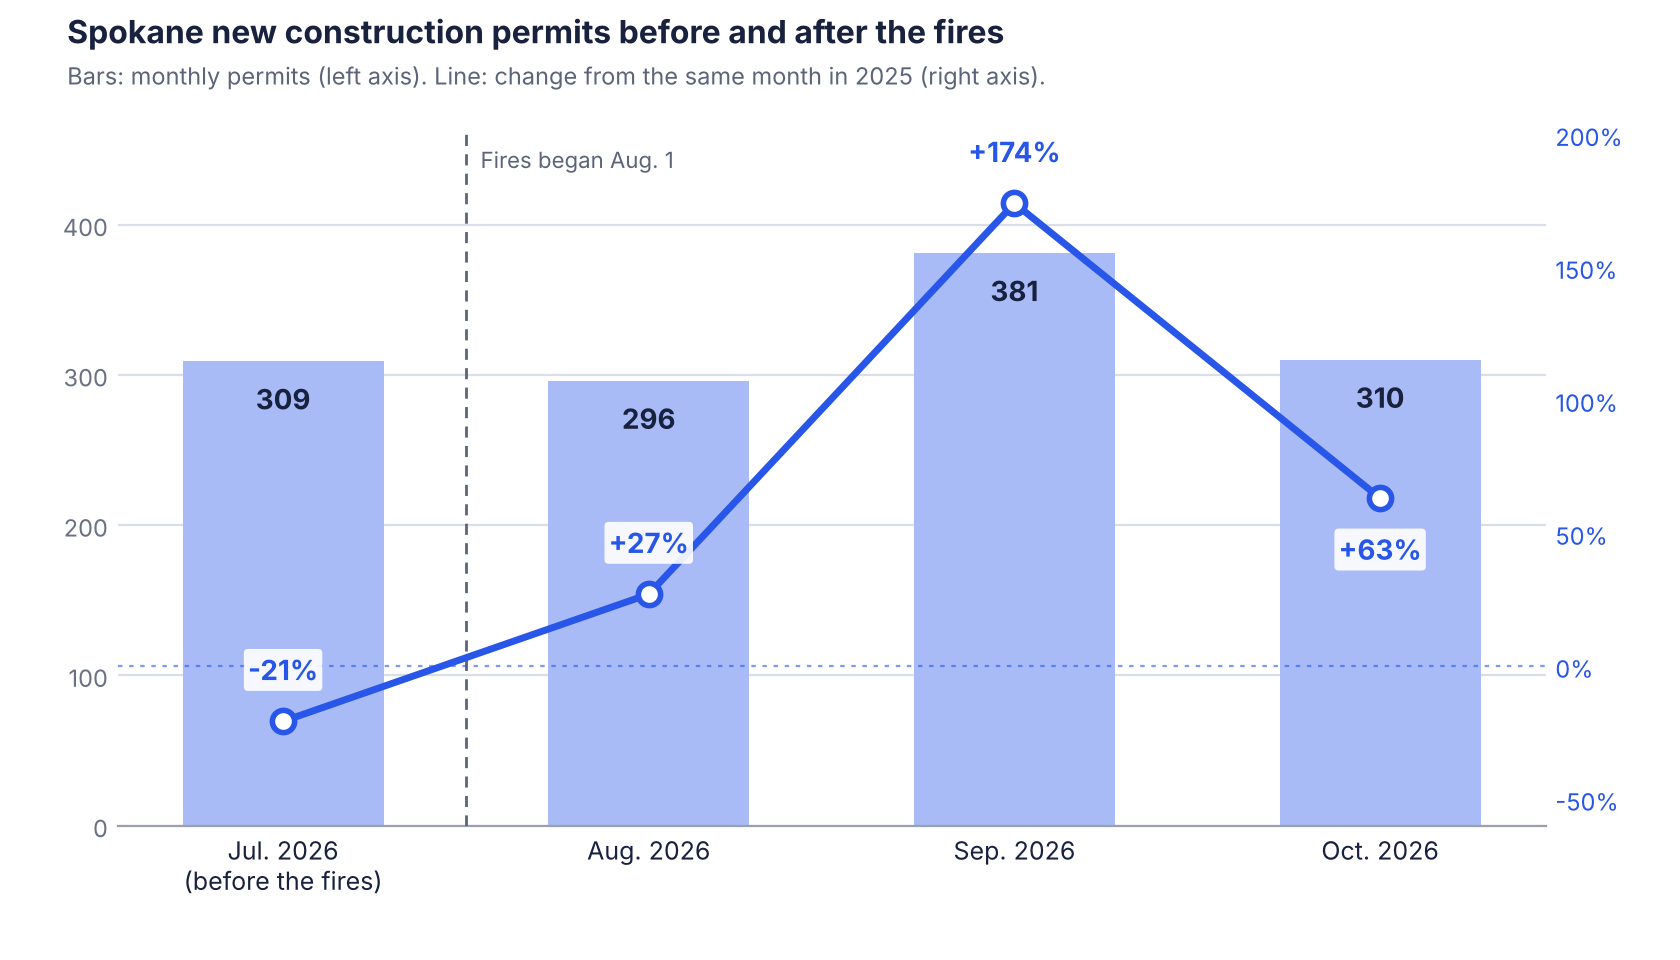
The Spokane Complex fires were the most expensive wildfires in Washington state history. The fires began Aug. 1, 2026 and destroyed roughly 900 structures. Insurance Journal reports insured losses near $1B from about 3,500 claims.
Gryd's Spokane permit months show a rise in new construction starting in the month of the fires and peaking in month 2 following the fires in a year over year comparison.
Over the full time period Nov. 2025 to Oct. 2026, Gryd counted 5,524 roofing permits in the metro compared to 3,516 in the prior 12 months (57% increase). Gryd's coverage in the metro also increased over this period, including areas the fires did not affect. We're continuing to monitor Spokane permit activity as recovery efforts continue.
Lack of permit activity can also show where recovery is stalling. A CU Boulder study of Marshall Fire claimants found that underinsured owners were 25% less likely to apply for rebuilding permits within a year and more likely to sell, and that 74% of claimants were underinsured. A portfolio view of permit activity by area can show where rebuilding is slower than the surrounding metro.
Bottom line
Gryd's permit records show post-disaster recovery trends differ depending on the type of work. Roofing permits tend to climb within a month of a hurricane, and in Spokane, new construction counts increased in the first three months after the fires. Weather affected areas can span many counties and cities, and each one publishes permits in its own system and format. Looking them up one by one is time consuming and can't be used for large scale modeling and analysis. Gryd identifies sources, extracts the records, standardizes and normalizes them, maps permits to properties and the associated contractors that gives granular insights and helps identify long term trends.
Teams that compare a live event against history from similar ones can estimate how much work to expect and when, check roof age and paid roof claims against documented work, watch where recovery is stalling, and validate contractor history.
Want to see permit history for areas impacted by weather recent events?
Resources
- CBS Miami, South Florida flooding live updates: https://www.cbsnews.com/miami/live-updates/south-florida-flooding-live-updates-heavy-rain-broward-miami-dade/
- KTLA, Southern California storm preparations: https://ktla.com/weather/southern-california-rushes-to-prepare-for-powerful-storm-flooding-and-mudslides/
- NOAA Climate Prediction Center El Nino advisory: https://www.cpc.ncep.noaa.gov/products/analysis_monitoring/enso_advisory/ensodisc.shtml
- Insurance Information Institute (Triple-I), severe convective storm losses: https://www.businesswire.com/news/home/20260414308638/en/
- Insurance Journal, Washington wildfire losses: https://www.insurancejournal.com/news/west/2026/11/12/892312.htm
- CU Boulder, Marshall Fire underinsurance study: https://www.colorado.edu/today/node/53955
- National Insurance Crime Bureau, contractor fraud after catastrophic weather: https://www.nicb.org/news/news-releases/contractor-fraud-surges-after-catastrophic-weather-events
- NACA, what is a catastrophe adjuster: https://www.nacaadjuster.org/what-catastrophe-adjuster-and-how-become-one
- Gryd permit data
- The Sacramento Bee, atmospheric river image: https://www.sacbee.com/news/weather-news/article318145913.html
- Washington Office of the Insurance Commissioner, hiring a contractor after a claim: https://www.insurance.wa.gov/hiring-general-contractor-homeowner-insurance-claims
- District of Columbia Department of Insurance, Securities and Banking, choosing a contractor: https://disb.dc.gov/node/1191027
Resources for people affected by severe weather
If you or someone you know is currently impacted by unfolding severe weather events, these resources can help with next steps:
- Florida: Post-disaster insurance claims and the flood claims process (Florida Department of Financial Services)
- California: Flood insurance resources (California Department of Insurance)
- Anywhere in the U.S.: Find disaster assistance and recovery centers (FEMA)
- Safety first: Returning home after a flood (American Red Cross)

Ready to use verified construction intelligence in your industry?
Tell us what your team needs to understand, which markets matter, and how you want to use Gryd data. We’ll help you find the right path.